TABLE OF CONTENTS
3. Uploading the execution report into Dashboard
4.3 Total Test Case Execution Summary
4.4 Total Tests Execution(Run) Duration
4.10 Test Severity Distribution
4.11 Test Health Score Distribution
4.12 Test Health Summary

2. Accessing the Dashboard
Sign in with your credentials. The Dashboard appears as your home page.
3. Uploading the execution report into Dashboard
| Applicable to Java Selenium, Python Selenium, TypeScript Playwright, JavaScript WebDriver IO scripts for web applications and Java Appium for Mobile App and Mobile Site applications |
As a new user, you will not be able to see any execution report in the Dashboard. You must have executed the script for a particular framework and generated a report using algoQA via the command prompt
For example, if you have generated Java Selenium scripts and wish to upload report onto the Dashboard via command prompt, run the following command:
java -jar algoQAUtil.jar -dashboard.Enter the Batch name and Test Suite name in the command prompt. You will be able to see the reports as described in the next section.
4. Using Dashboard
The landing page of the dashboard is divided into two main sections: Test Execution Summary and Test Health.
Test Execution Summary includes:
- Total Test Case Execution Summary
- Total Tests Execution(RUN) Duration
- Batch Execution Overview
- Failure Trends Over Time
- Test Suite Summary
- Test Suite Overview
- Batch Execution Summary
Test Health includes:
- Test Severity Distribution
- Test Health Score Distribution
- Test Health Summary
4.1 Dashboard Header
The dashboard header displays the selected project name, a notifications icon, filter and export buttons, as well as key metrics including total projects and total batches executed.
4.2 Selecting the project
You can select the required project by clicking the Filter button. The filter panel provides several options:
- Date Selection Filter: Filter projects by date using predefined options such as Today, This Week, This Month, This Year, or a Custom Range.
Note: If there is only one business unit, only the Project Name field is shown in the filters. If there are multiple business units, a Business Unit field also appears, displaying all available business units in a dropdown.

- Project Selection Field: Search and select a specific project by typing its name.
After selecting your filters, click Apply to view the project details on the dashboard.
Additional options:
- Click Reset to clear all filters.
- Click Cancel to close the filter panel without applying changes.
4.3 Total Test Case Execution Summary
 | Located in the left pane of the dashboard under Tests Execution Summary, the Total Tests Execution Summary displays a graph in the form of a pie chart. This chart summarizes the total number of tests executed in the latest batch. The chart uses a color-coded scheme:
Hovering over each color segment reveals a tooltip showing the exact number of test cases for that category. |
4.4 Total Tests Execution(Run) Duration
Located in the right pane of the dashboard under Tests Execution Summary, this section displays the total test execution time, the average time per batch execution, and the average time per test.
4.5 Batch Execution Overview
Located under the Total Test Case Execution Summary, this bar graph provides an overview of batch executions. You can filter the data by daily, weekly, monthly, yearly, or custom intervals. Hovering over each bar displays the number of batches, the number of runs in each batch, and the pass, fail, and skip counts.
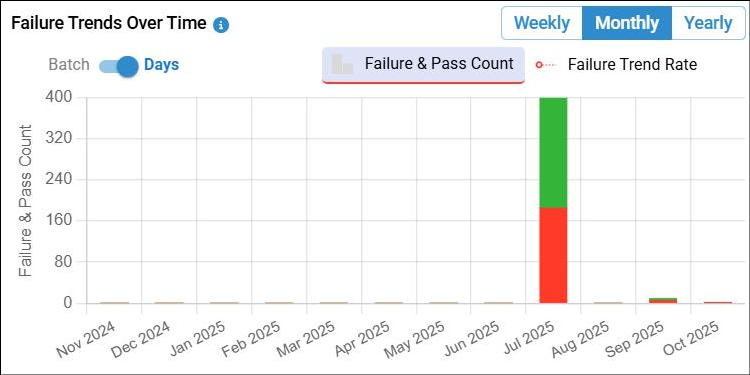
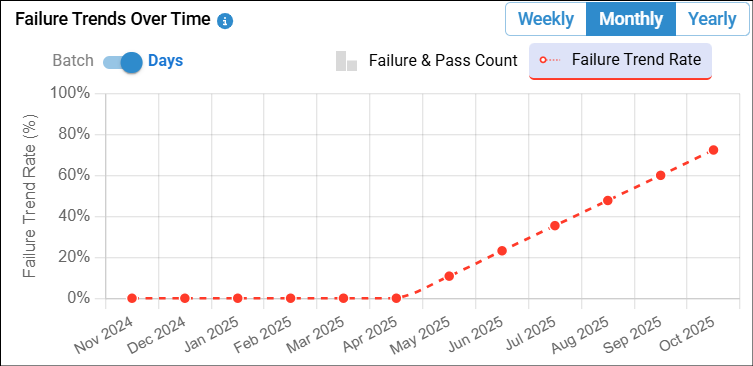
4.6 Failure Trends Over Time
Located under Tests Execution Summary, below the Total Test Execution Duration, Failure trend over time graph displays Failure & Pass count and Failure Trend Rate in two different ways:
- Batch
- Days
Click the More icon (three dots) to also view data by suite.
- When Batch is selected
- Failure & Pass Count is displayed as bars for the latest 7 batches.
- Failure trend graph for these batches are shown when user selects Failure Trend Rate under Batch.


2. When Days is selected
- Failure & Pass Count is displayed as bars and user can see the data of weekly, monthly and yearly.
- The Failure Trend graph for these batches is displayed when you select Failure Trend Rate under Batch.
4.7 Test Suite Summary
Located under Tests Execution Summary, below the Batch Execution Overview, clicking the More icon (three dots) allows you to select a test suite. This view displays the pass rate and fail rate, the number of tests passed, failed, and skipped, the total tests executed, and the duration of execution.
4.8 Test Suite - Overview
Located under Tests Execution Summary, below Failure Trend Over Time, this section displays the total number of runs from the particular suite, pass rate (%), execution duration, and severity level for each test suite.
4.9 Batch Execution Summary
The representation of test cases executed in batches is displayed in a tabular format. Each line item includes the Batch execution name, the Batch ID, which is a unique identifier for the generated report, Test Suite name, the name of the person who executed the test case, the start date of the test execution, the end date of the test execution, the time taken to execute the test cases in seconds, Test Runs and the numbers of passed, failed, and skipped test runs. You can select pagination option for navigating through multiple pages of results. If you have executed the test cases in batches, then those files are combined with the same tags. These combined line items cannot be deleted, it can only be downloaded. Whereas, the single batch file can be deleted and downloaded. You can perform these actions by selecting More Menu (3 dots) option in the Action column. You can view the individual report in the PDF or Extent report format by selecting the View Spark Report and View PDF Report options from More Menu in the Action column. You can search for a particular batch execution details by providing the required Batch Name, Batch ID and Executed by options. You can also Smart Order the executions by clicking on Smart Ordering, To know more click on Smart Ordering.
By clicking on a batch, you can view the Total Unique Test Case Execution Summary, Failure Analysis Summary, failure Analysis, All Test Executions, Failure Executions and Slowest Executions.
Under Total Unique Test Case Execution Summary, you can view:
- Pass Rate (%): The percentage of test cases that passed.
- Execution Results: The number of test cases that Passed, Failed, or Skipped.
- Total Unique Test Cases Executed: The total number of unique test cases that were executed.
Under Failure Analysis Summary, you can view the number of test cases that failed in each category within a batch.
Under Failure Analysis, you can view the details of each test case within the selected batch. Failed test cases are grouped by failure category and listed in the Category List. Selecting a category displays all failed test cases associated with that category.
You can also edit a category name if it is not relevant by clicking the Edit icon next to the category. If a test case requires a new category, click the More icon (three dots) and add a new category for that test case.
By clicking on a test case, you can view the failure reason, number of test runs, and details such as scenario name, tags and scenario outline. You can also use the Filter option to filter test cases by failure reason. If a test case has multiple failure reasons, all applicable reasons will be displayed.
By clicking on a failure reason, the corresponding test case ID is displayed. Selecting the test case ID shows the detailed failure reason, along with an option to add suggestions.
Under All Tests Executions, you can view all the test executions under the selected batch.
By clicking the down arrow of the test case, you can view the result of every run of that particular test case, see the reason for any failures, and provide suggestions if needed.
Under Failure Executions, you can view the Failed test executions under the selected batch.
Under Slowest Executions, you can view the slowest test executions under the selected batch.
You can use the expand arrow to enlarge the table for a better view, which will hide the Total Unique Test Case Execution Summary and Failure Analysis Summary. Click the collapse arrow to view the summaries again.
An Export option is available for Failure Analysis in the top-right corner. The details of the selected batch can be exported in Excel or HTML format.
- HTML Export: By default, Charts & Graphs, All Test Executions, and Failure Analysis are selected.
- Additional Options: You can also choose Failure Executions and Slowest Executions.
Select or deselect the desired options and click Download to export.
4.10 Test Severity Distribution
Located under Test Health in the left pane, this section displays the severity distribution, showing the tests categorized as Critical, High, Medium, Low, and Minimal. Severity measures how reliable and stable the test executions are, based on test outcomes and overall health patterns. Hovering on each category shows the number of scenarios and percentage of that particular category. You can also view them in different types of graphs like Polar graph, bar graph, line graph and doughnut graph by clicking on graph selector.
Note: You can customize the ranges for Critical, High, Medium, and Low by using the range selector. Modify the values as needed and click Apply. The updated ranges will take effect immediately.
4.11 Test Health Score Distribution
Located under Test Health in the right pane, this section displays the overall test health score, categorized as Excellent, Good, Moderate, Poor, and Critical. Health Score shows how stable and reliable the test results are over time. Hovering on each category shows the number of scenarios and percentage of that particular category. You can also view them in different types of graphs like Radar graph, bar graph, line graph and pie graph by clicking on graph selector.
Note: You can customize the ranges for Excellent, Good, Moderate, Poor and Critical by using the range selector. Modify the values as needed and click Apply. The updated ranges will take effect immediately.
4.12 Test Health Summary
Located under Test Health, below the Test Severity Distribution, you can view detailed test case information. Using the dropdown, you can select either Severity or Health Score to see the number of test cases that fall within the defined ranges.
 You can also view the total number of test cases, total batches, and total duration.
This table is grouped by scenario name and displays the scenario name, component, number of passed, failed, and skipped batches, failure rate (percentage), duration, health score (percentage), severity, last failure date, and defect ID. You can also search the scenarios using the search field. You have filter option to filter by suite. By clicking on a scenario name, you can view all batches containing that scenario, along with details such as Batch Name, Batch ID, User Name, Test Suite, Test Runs, Status, and Run duration. Above this table you can also view Scenario name, Total batches, Total Test Runs, Total Duration and Failure Rate.
Note: To navigate back to the main table click on Test case Details.

By clicking on batch name, you can view test runs of that scenario under the selected batch, including status, duration, start date and time, end date and time, comments of each run.
Note: To navigate back to the main table click on Test case Details.

By clicking on a failed result, you can view the failure reason along with screenshot of failure and add your suggestions.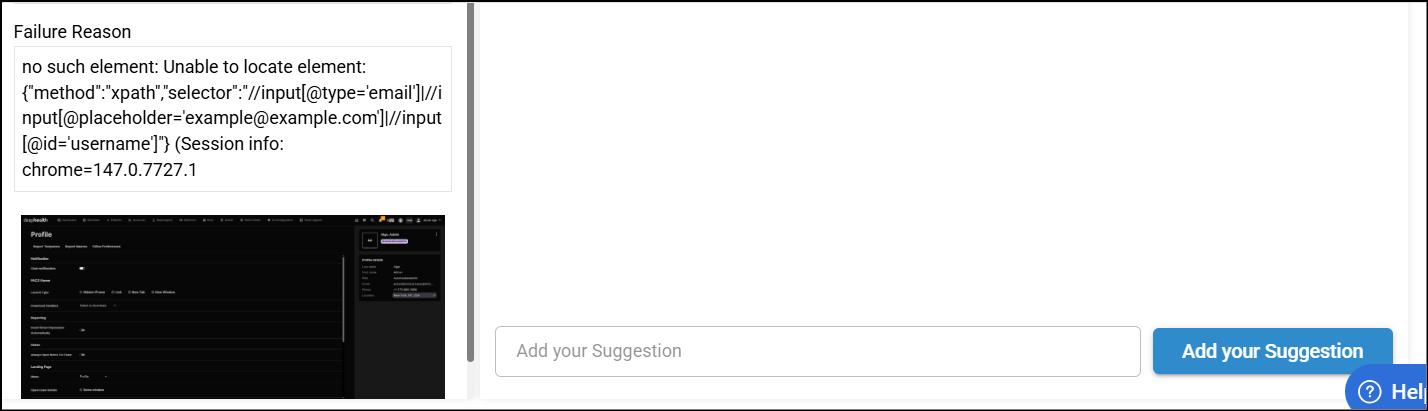
4.13 Exporting the Report
You can export the report by clicking the Export Report button on the top-right corner. You can download the results in the CSV, Excel or Html format, select the required options from Batch Execution Summary or Batch Execution Result sections. Note that you will not be able to uncheck Batch Name option.
Was this article helpful?
That’s Great!
Thank you for your feedback
Sorry! We couldn't be helpful
Thank you for your feedback
Feedback sent
We appreciate your effort and will try to fix the article